Performance Testing Basics with JMeter

Overview
Apache JMeter is an open-sourced popular tool used to execute Performance testing for applications. If the success of your business weighs heavily on how well your application handles increased numbers of users, then Performance testing should be an essential piece of your testing strategy. For example, e-commerce websites typically experience large numbers of users during Black Friday sales. As a result, those businesses could lose millions of dollars if their applications lack the design to handle increased loads to complete sales transactions. This blog will cover the basics of using JMeter by designing and executing a test plan against a Computer database application. Next, we will review the application to test.
Computer Database App Overview
The Computer Database application we will use to execute Performance testing allows users to display filtered computers by name:
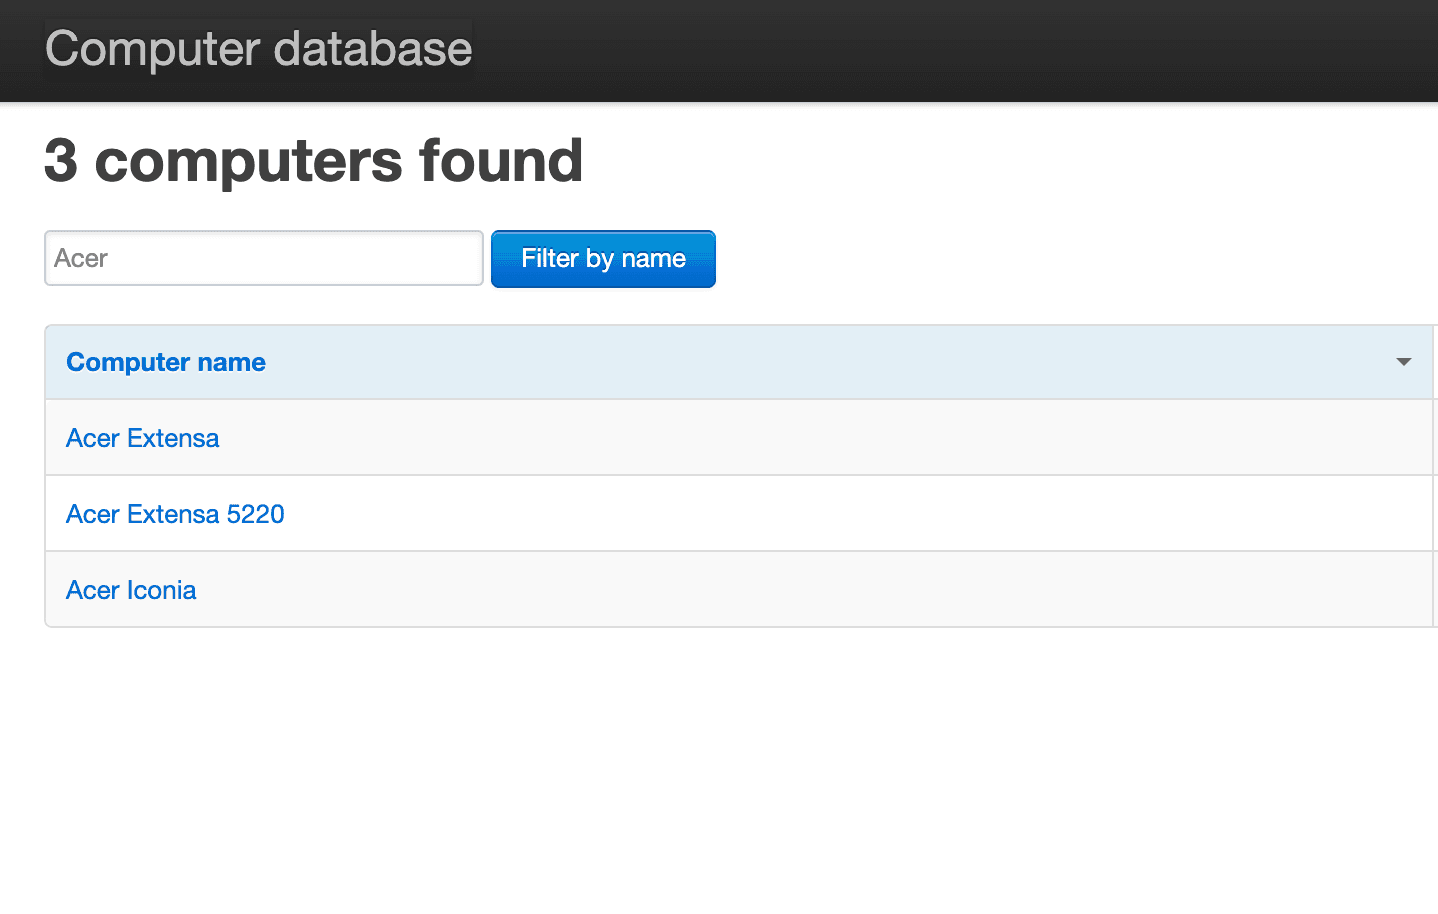
In the previous screenshot, search results display all computers that include the name "Acer." Users can also add new computers or edit current computers:
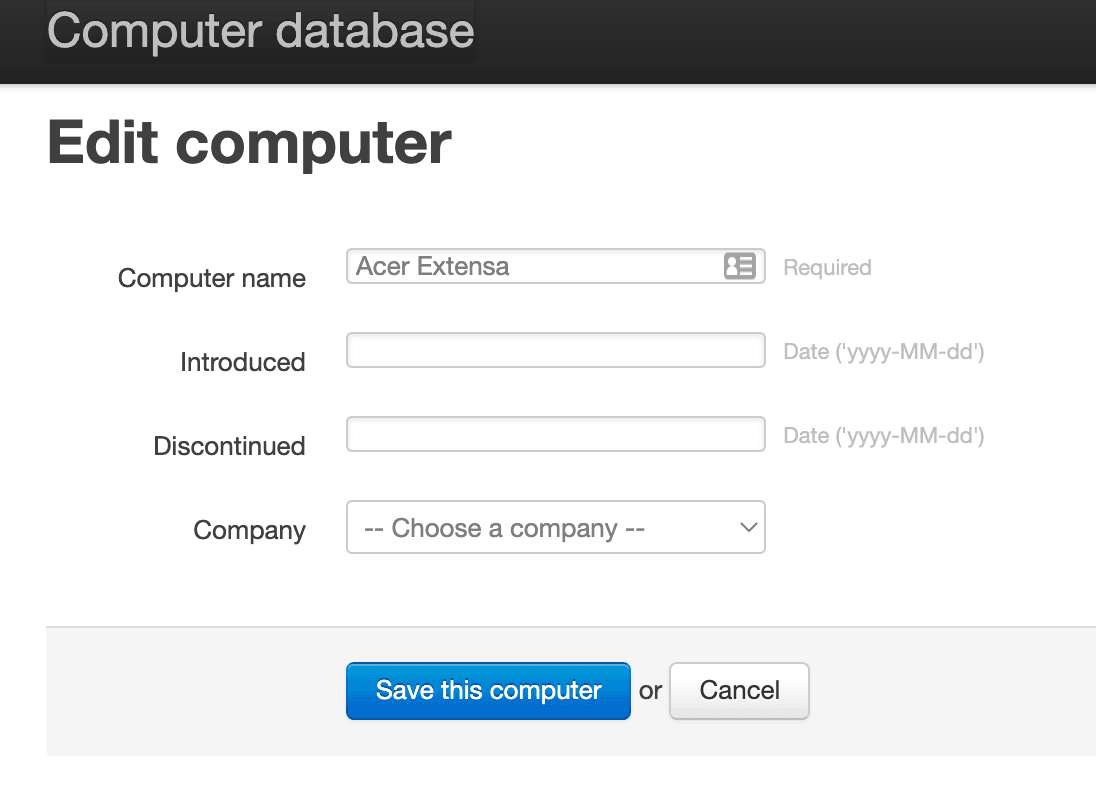
The previous screenshot displays a form that allows users to update details for the "Acer Extensa" computer. Next, we will assess the application's responsiveness when many concurrent users complete actions to edit a computer.
Overview of the Load Profile to Create
A load profile consists of the number of virtual users accessing an application, the operations completed, and their intensity while navigating the site. For example, the "edit a computer" operations our virtual users will execute consist of four steps:
- First, navigate to the site.
- Second, enter a computer name and click the "Filter by name" button.
- Third, select the computer to edit from the filtered list.
- Lastly, edit details and submit the form.
We will test the application with 50 concurrent users for our test plan (Note: significantly higher numbers of users would be used for testing in real-life production applications). In addition, we will add specific delays to requests to mimic real-life behaviors when users need time to think before completing actions. Also, we will assert the expected response code in the server's output. Finally, we will generate reports to analyze and understand how the application responded to the load.
Installing JMeter
Before running tests with JMeter, we first need to install it. The Apache JMeter site
provides download instructions for the latest version. You also need at
least Java version 8 installed on your machine to use JMeter.
After installing JMeter, we can create and execute our test plan. Navigate to the bin folder where JMeter is
installed and use sh jmeter.sh in the terminal to open JMeter. You can also create
an alias to open JMeter
using one command quickly from anywhere in your system. Finally, we can use an additional tool to lessen creating our
test plan in JMeter. In the next section, we will learn how to use BlazeMeter to speed up building our JMeter test plan.
Implementing The Test Plan with BlazeMeter
BlazeMeter eases the creation of our test plan in JMeter by allowing you to record actions as you use the application in the browser and convert the outcome into a file that JMeter understands. To use BlazeMeter, first, install the associated Chrome extension and create a free account. Next, log into your BlazeMeter account, start a recording session, navigate to the site in the Chrome browser, perform actions to edit a computer, save the recording as a JMX file, and finally, import the JMX file into JMeter.
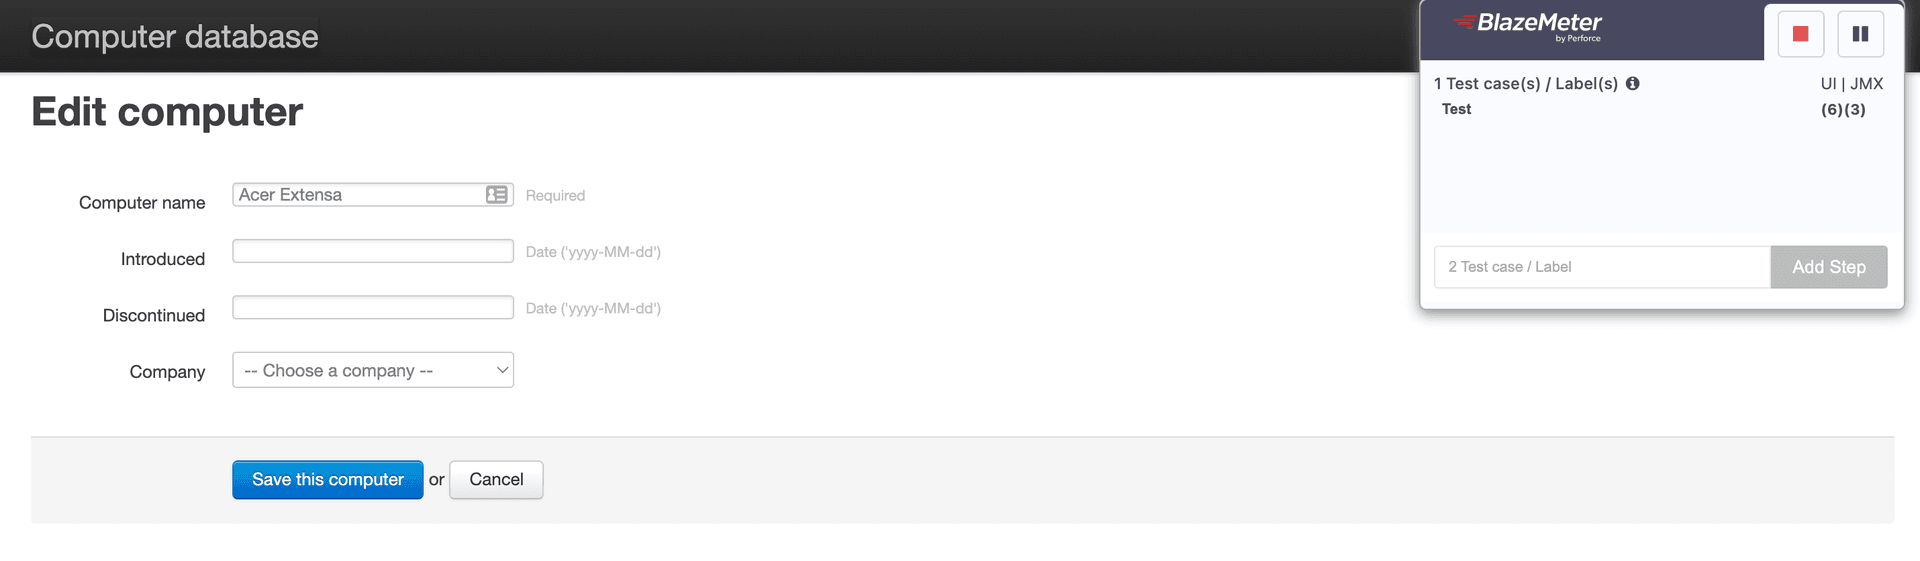
In the previous screenshot, we see a snippet of BlazeMeter recording actions on the site in the browser. In the following sections, we will learn about the JMeter elements created by our recorded script using BlazeMeter.
Understanding Thread Groups
Thread Groups represent a specific number of users to access the software under test (SUT). BlazeMeter includes one user (i.e., thread) in the generated script by default. We will update the users to the desired number of 50. In addition, we will specify how often to add new threads every second using the Ramp-up period. We will use 10, meaning we want all users added in ten seconds. JMeter will add users in increments of 5 every second since (50 users / 10 ramp-up seconds) = five users per second. Lastly, we configure the thread to run once by specifying the Loop Count as 1:
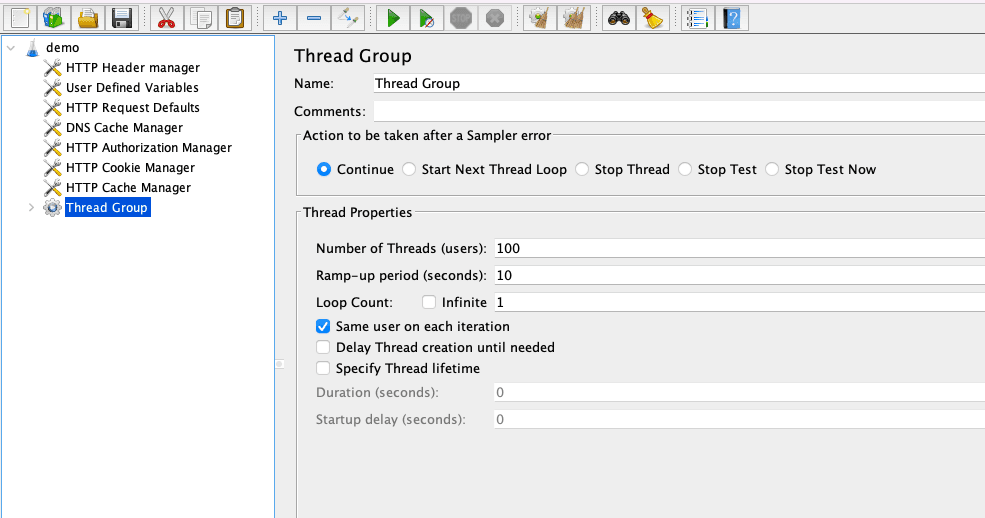
In the previous screenshot, we updated the number of concurrent users to 50, The Ramp-up to 10, and Loop Count to 1.
Understanding Controllers
Controllers allow us to group requests in folders and can also be used to control the processing order of the request URLs we visit. There are various controllers we can use in JMeter based on needs. For example, BlazeMeter grouped our requests inside the "Transaction Controller" that we labeled as "edit computer details." The "Transaction Controller" adds an extra section to the test results, which measures the overall time to perform all requests nested in the folder:
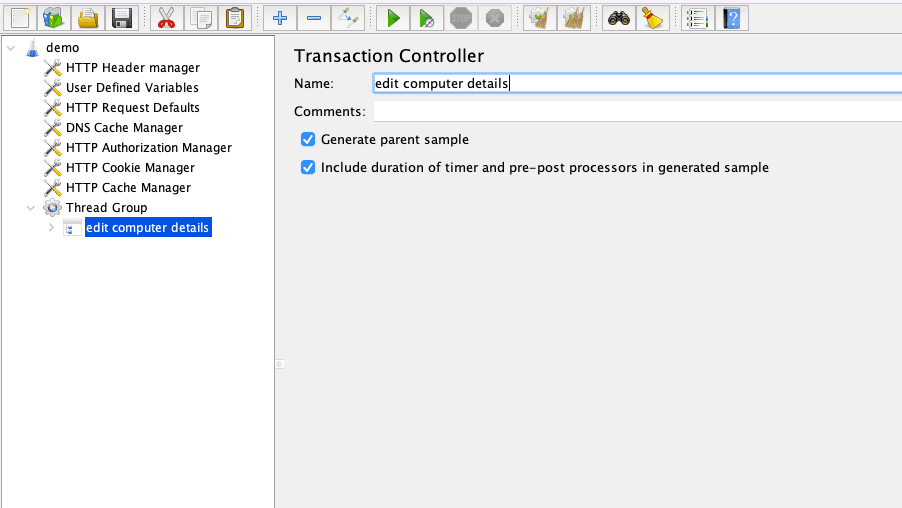
In the previous screenshot, we see the "Name" and "Comments" fields and selected checkboxes for "Generate parent sample" and "Include duration of timer and pre-post processors in generated sample." By selecting " Generate parent sample," the test results will only show the parent folder for all requests in the test results report versus displaying each request individually. By selecting "Include duration of timer and pre-post processors in generated sample," test results will include artificially added time (e.g., think time) to the request via JMeter Timers. We will better understand the checkbox values in a later section in the blog.
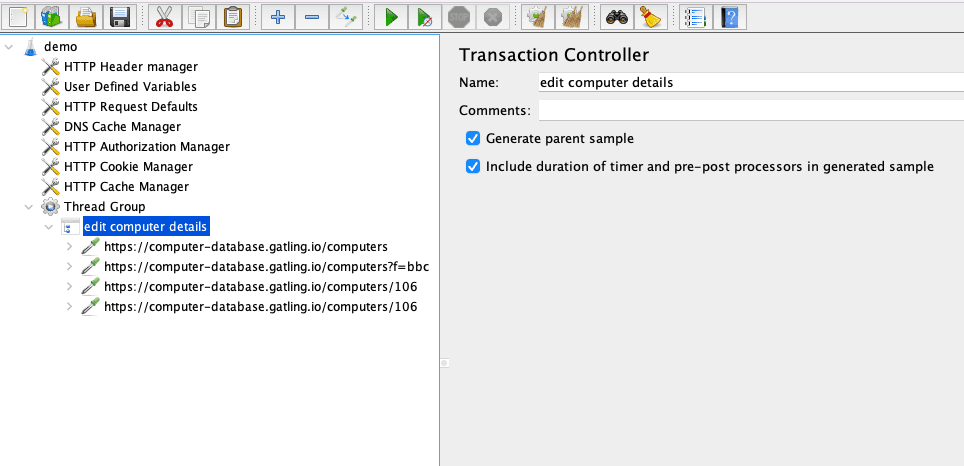
Understanding Samplers
Samplers represent the URL of the server you want to test. BlazeMeter automatically created samplers for every webpage we visited in the recording, labeled them with the URL used in the request, and stored them inside the "edit computer details" controller:
To make the samplers clear, we will edit the sampler names:
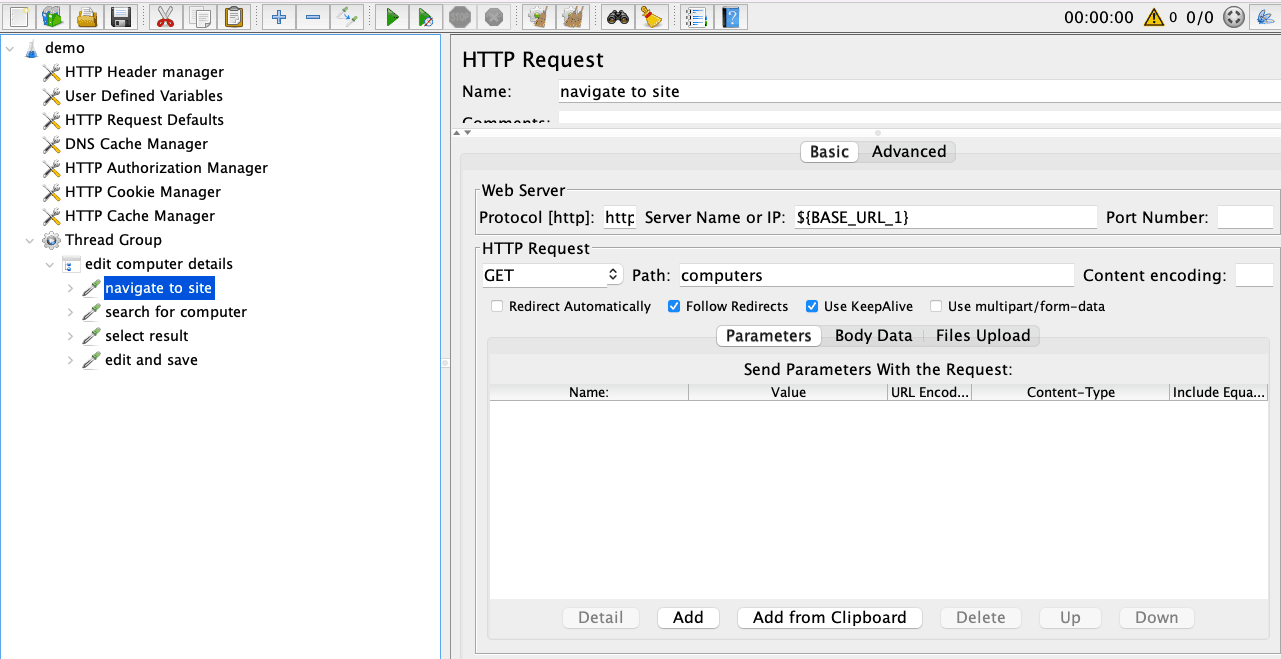
We edited all the sampler names in the previous screenshot to provide more context to the specific step. For the
currently selected "navigate to site" sampler, notice the value ${BASE_URL_1} for "Server Name or IP" inside
the "Web Server" section of the "HTTP Request" window. The value is a variable created in the "User Defined
Variables" added to our test plan by BlazeMeter. The "User Defined Variables" is an example of
many Configuration Elements we can add
to our Test plan via right-clicking on the test plan (i.e., demo) and selecting Add -> Config Element:
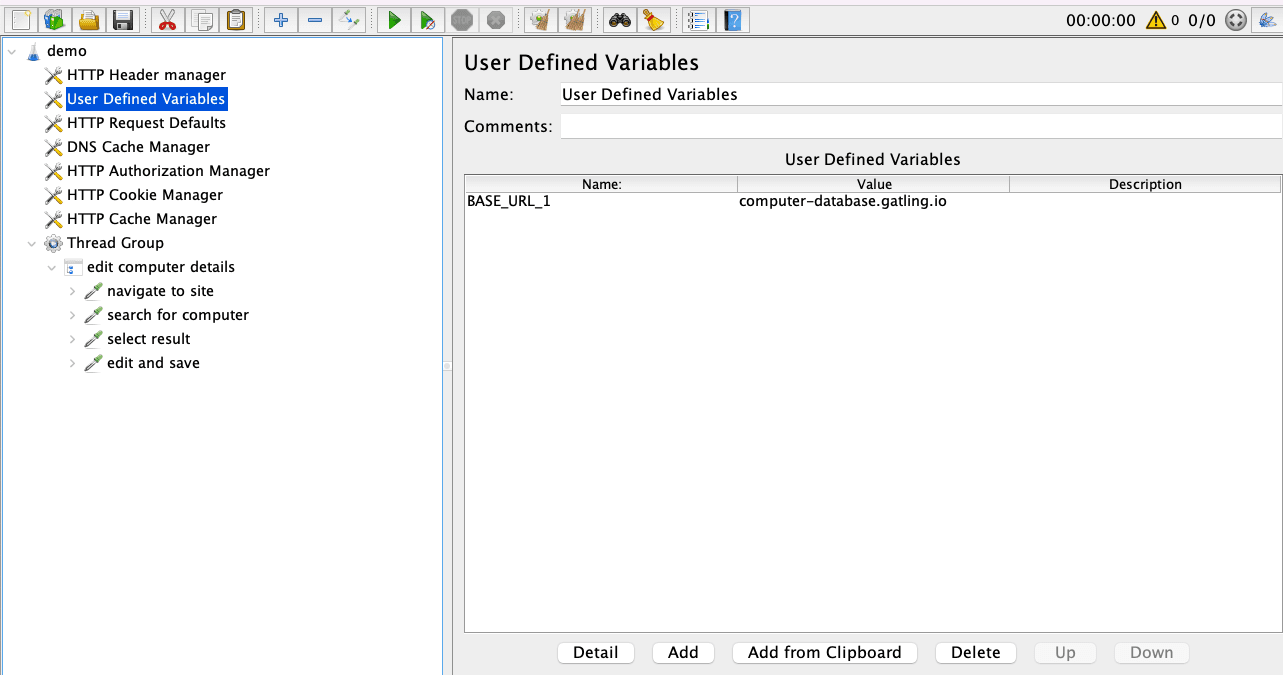
In the previous screenshot, we see the "Name" and "Value" for our ${BASE_URL_1} variable. The benefit of using
a variable is that if the value ever changes, it only needs to be updated in one location versus every instance where
the value is used. Also, inside the "HTTP Request" window, we can set many other values for the request. For
example, we can set the request method with "HTTP Request," the "Path" value, and even the HTTP protocol.
Understanding Timers
When users interact with applications, it is customary to complete specific actions such as filling out sign up forms. The extra time needed to do particular activities is known as "think time." We can mimic think time in JMeter using Timers. The first JMeter timer we will add is "* _Constant Time."** The "Constant Timer"** executes a hard-coded delay before each request. For example, we can add a _ *"Constant Timer" for the "search for computer" and **"select result"** samplers:
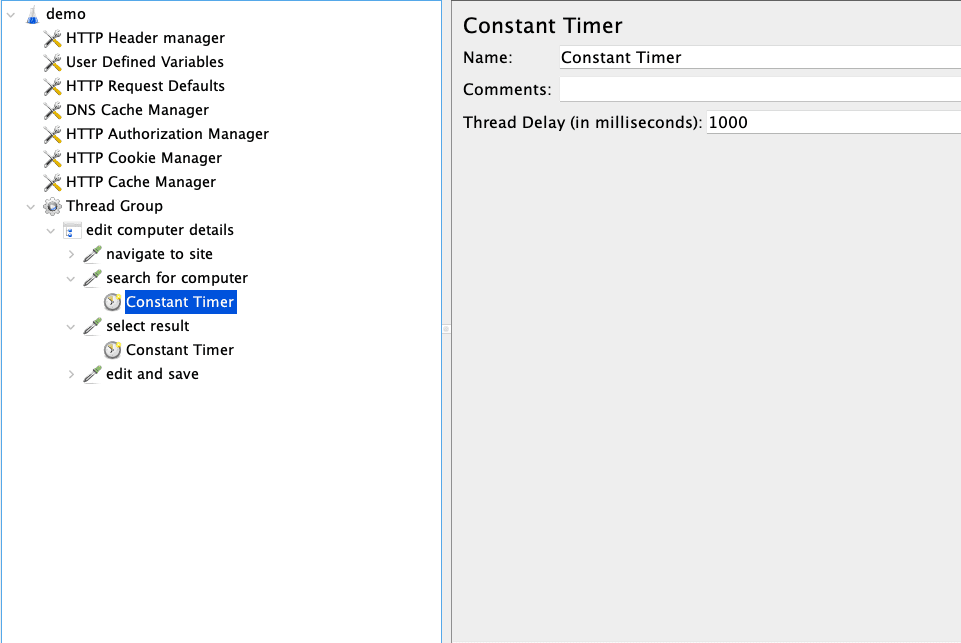
We added a "Thread Delay" of 1000 milliseconds (i.e., 1 second) for the two noted samplers in the previous screenshot. For the "edit and save" sampler, we will use the "Uniform Random Timer." The "Uniform Random Timer" allows you to add random delays to requests:
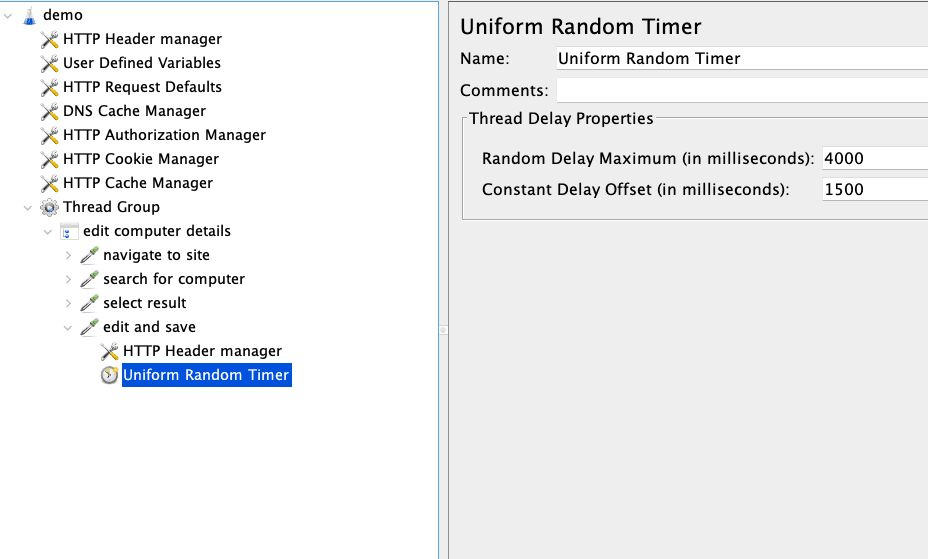
We added a "Random Delay Maximum" of 4000 milliseconds and a "Constant Delay Offset" of 1500 milliseconds in the previous screenshot. The values added mean there will be a delay between one and a half and four seconds before the sampler completes.
Understanding Listeners
We need to create reports to analyze and understand the application's performance after test runs. JMeter provides many listeners to display test run data in various ways. We will add two listeners:
- View Results Tree
- Aggregate Report
The "View Results Tree" listener is suitable to view the request and response data and assertion results while running JMeter via the graphical user interface (GUI). Note that the "View Results Tree" listener is not ideal for production because it provides non-aggregated data, so remember to remove it before running JMeter via the command line. The "Aggregate Report" listener is suitable to view essential performance data such as the average response time and throughput:
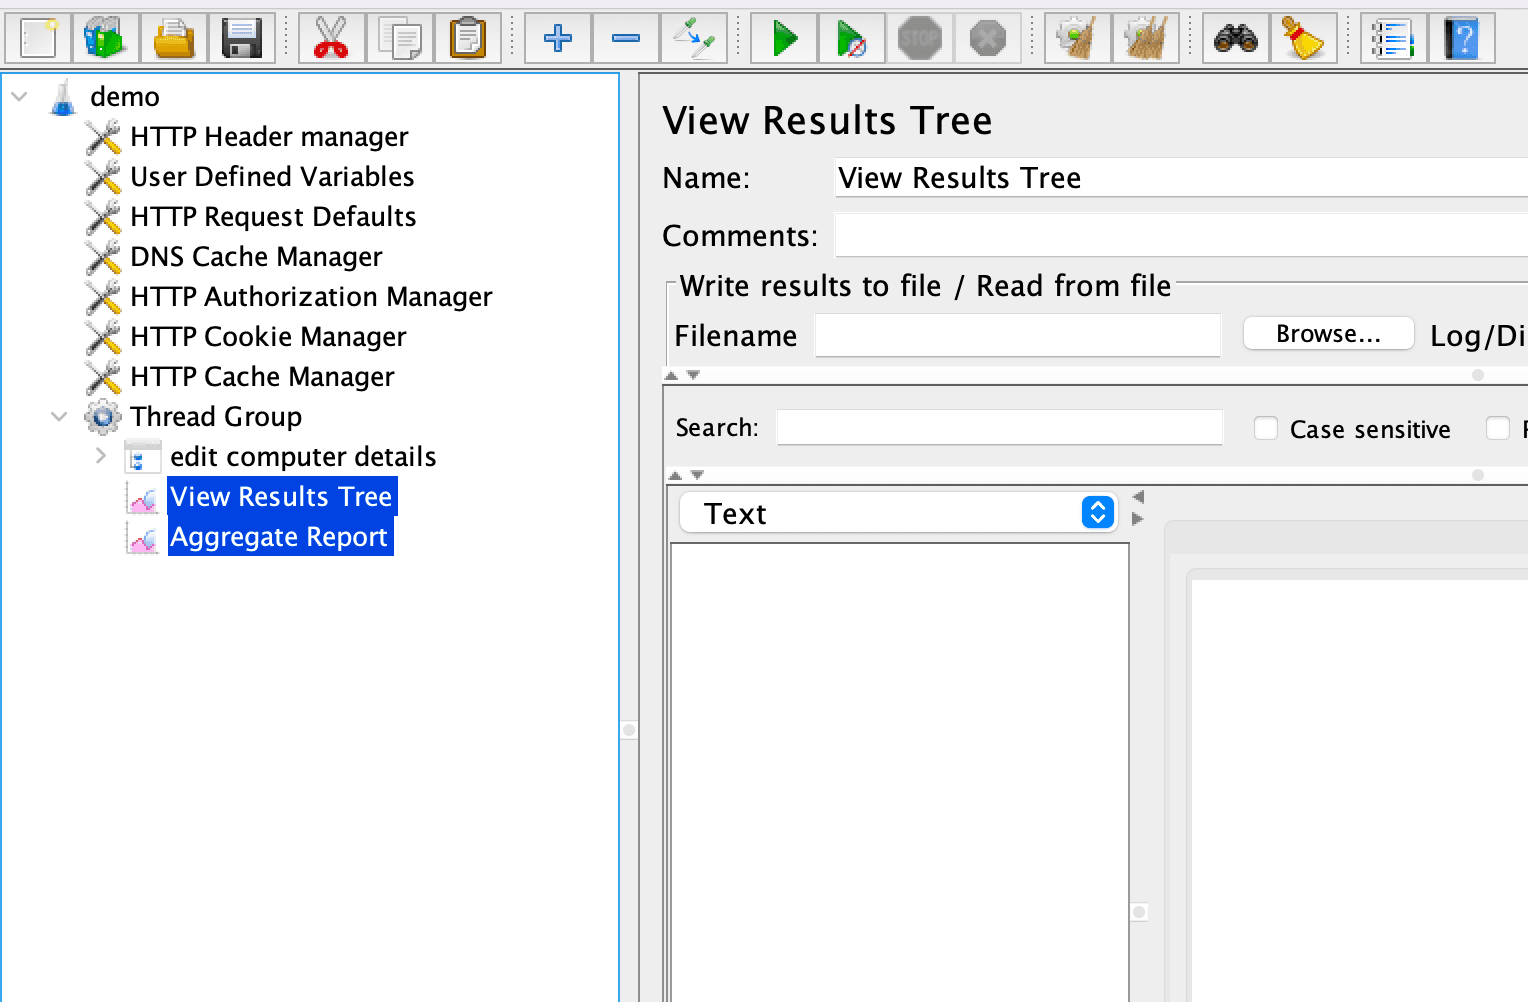
In the previous screenshot, we can see all the listeners added to the test plan nested in the Thread Group.
Adding Assertions
We can add assertions to verify expected responses from the server. For each request, we will confirm the response returns a 200 status code:
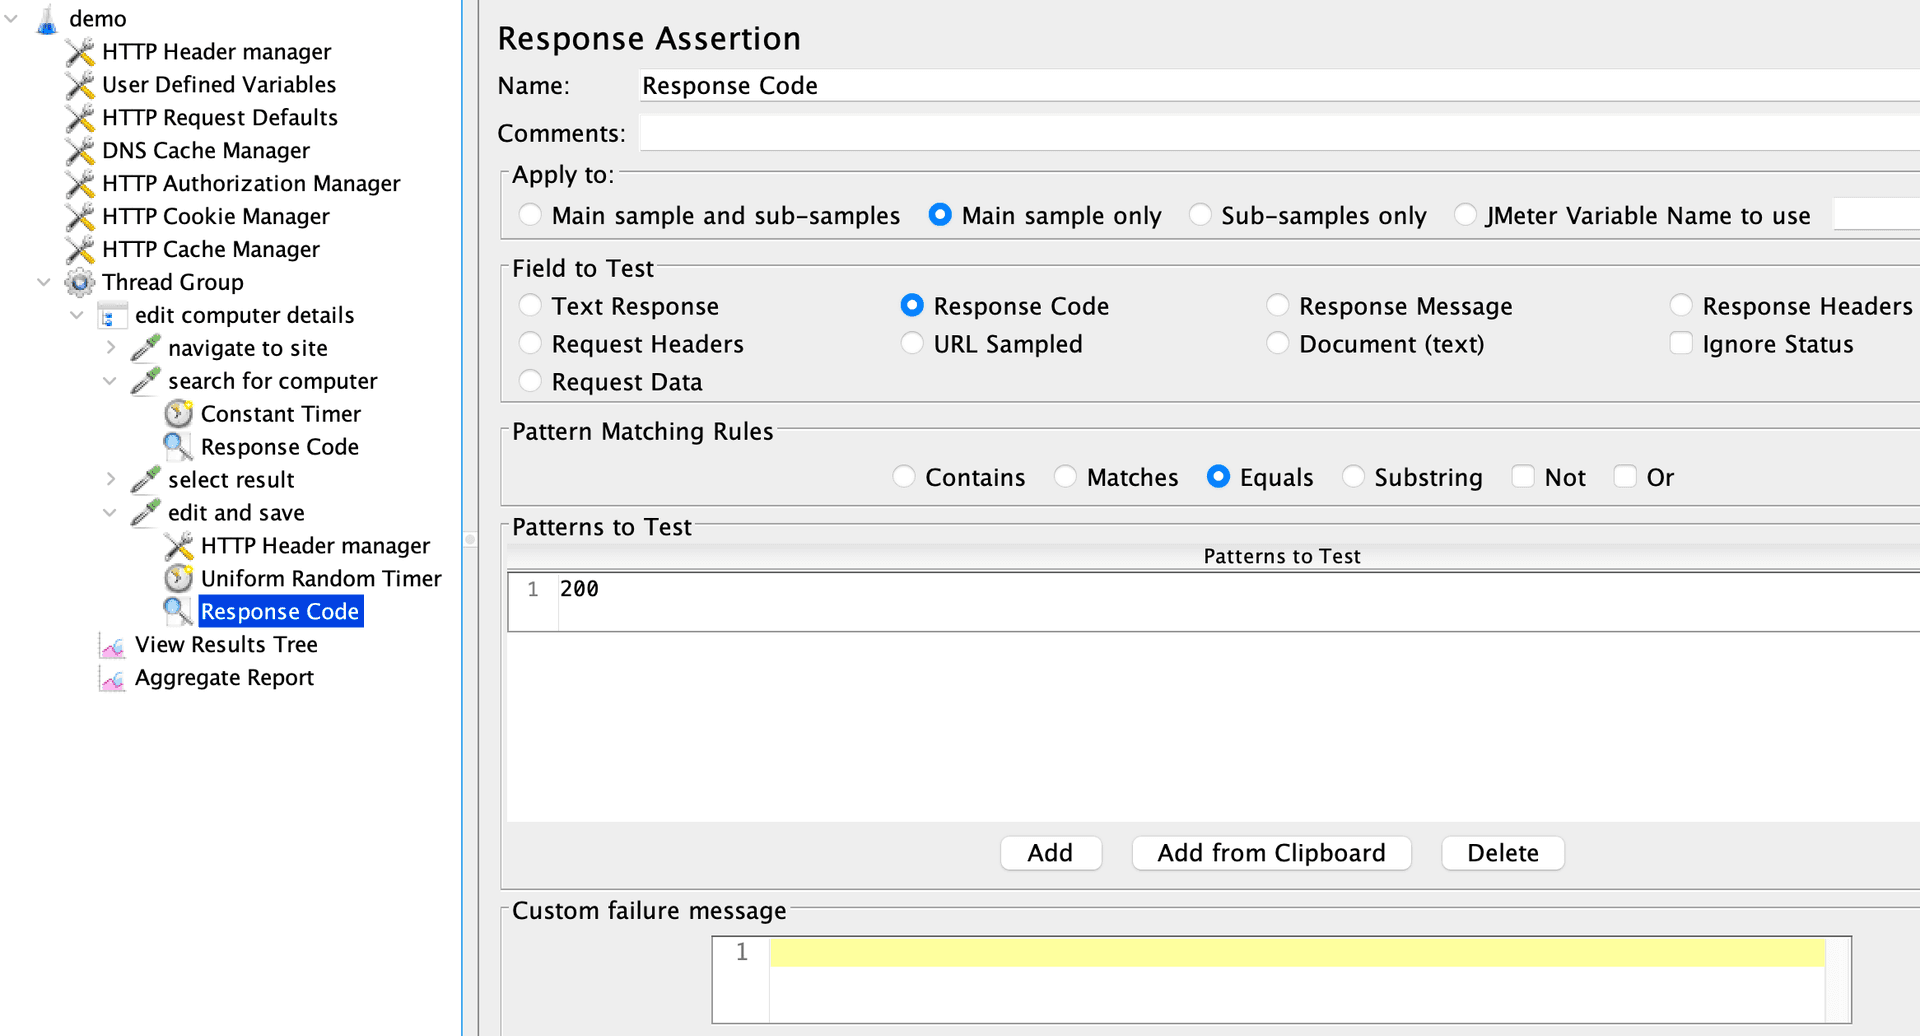
We added an assertion to each request in the previous screenshot verifying that the "Response Code" equals 200.
Running the Test Plan from the GUI
To see how our test plan runs and to debug, we can click the "start button" inside the GUI:
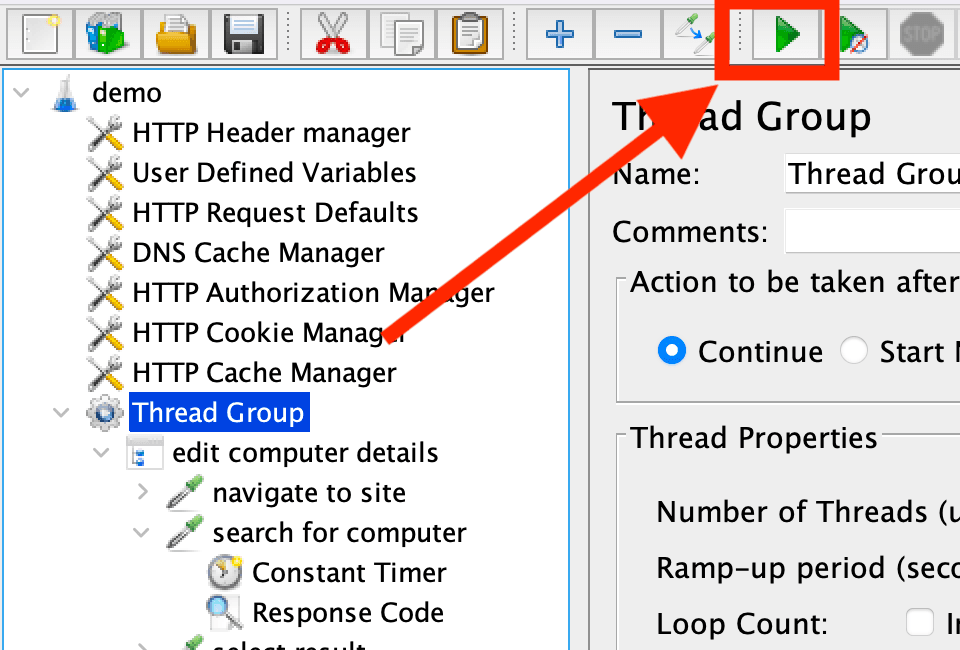
In the previous screenshot, the green "start button" is highlighted. Once the test run finishes, we can view reporting data generated in our listeners. Note: for demonstration purposes, the following examples use ten users. For example, the "View Results Tree" data is as follows:
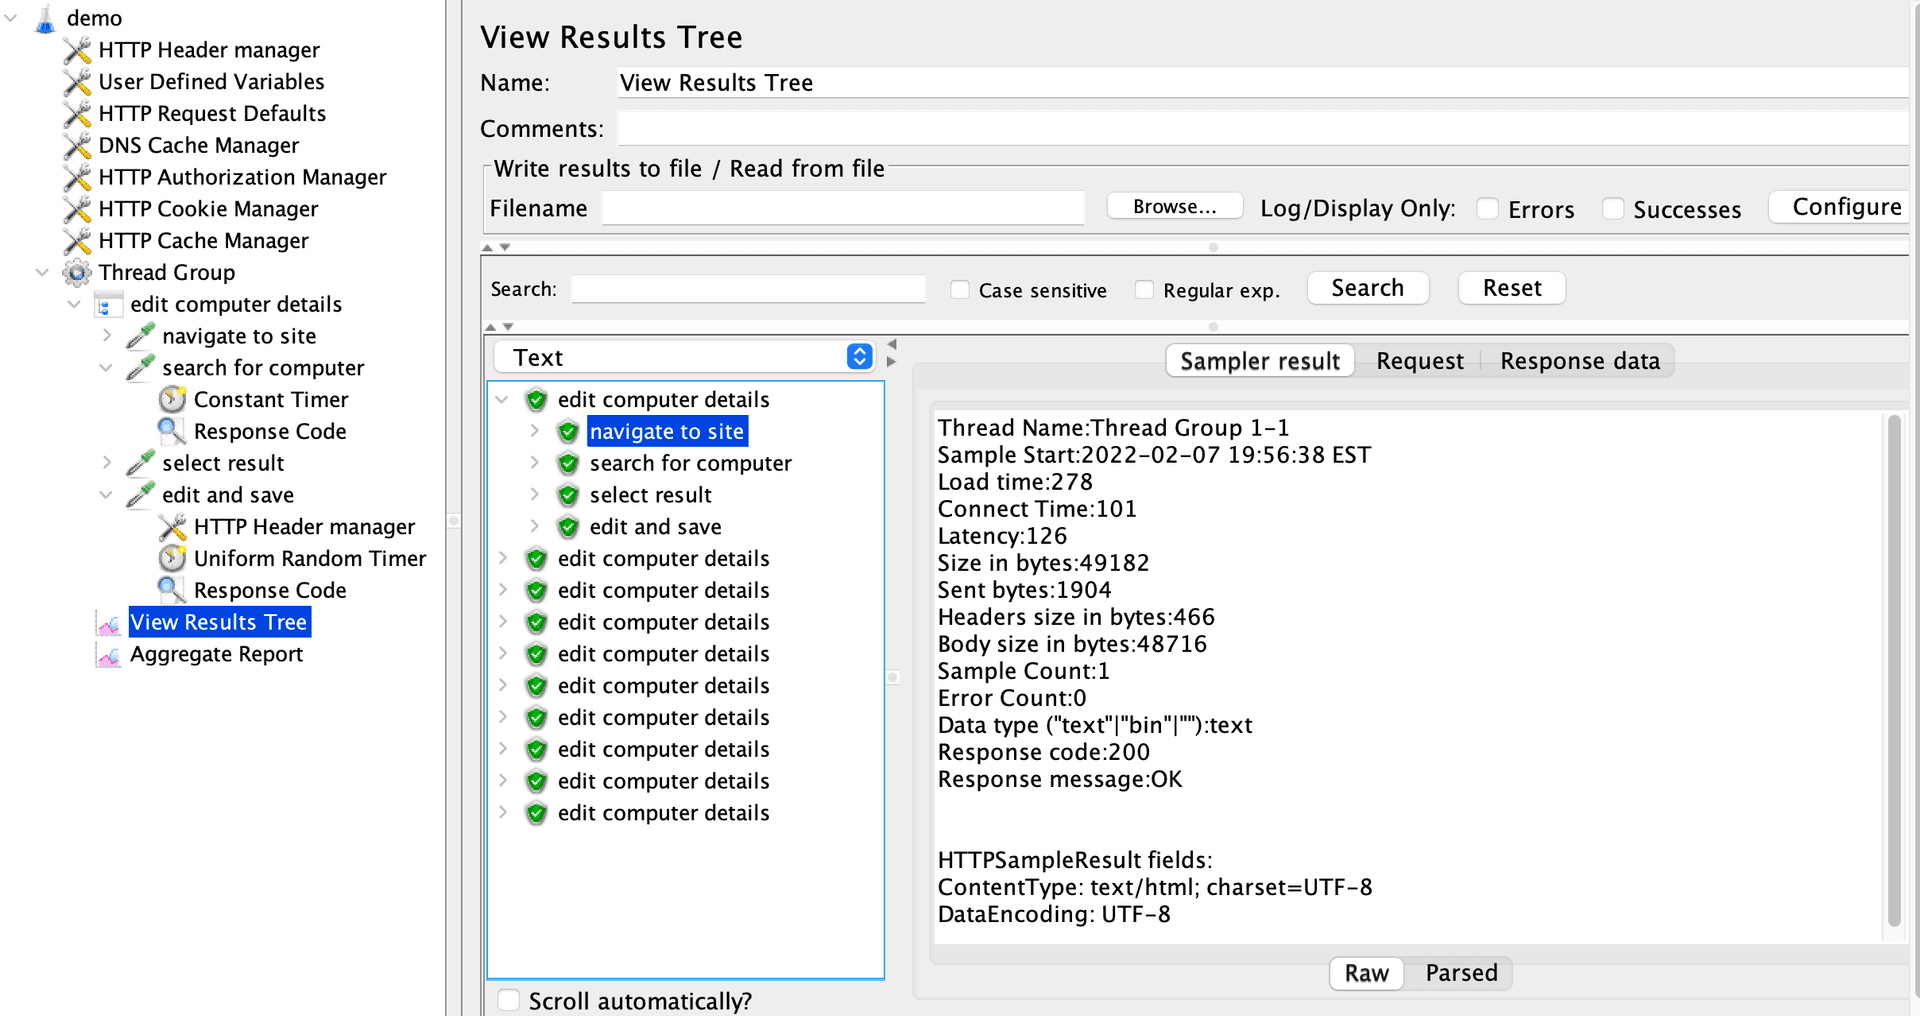
In the previous screenshot, we see ten rows representing all ten users accessing the site. In an earlier section, " Understanding Controllers," we selected the "Generate parent sample" checkbox. By checking that box, we first see the parent "edit computer details" and have to click into it to see the individual requests. Nested inside each row is response information for each page request. Next, we can look at "Aggregate Report" data:
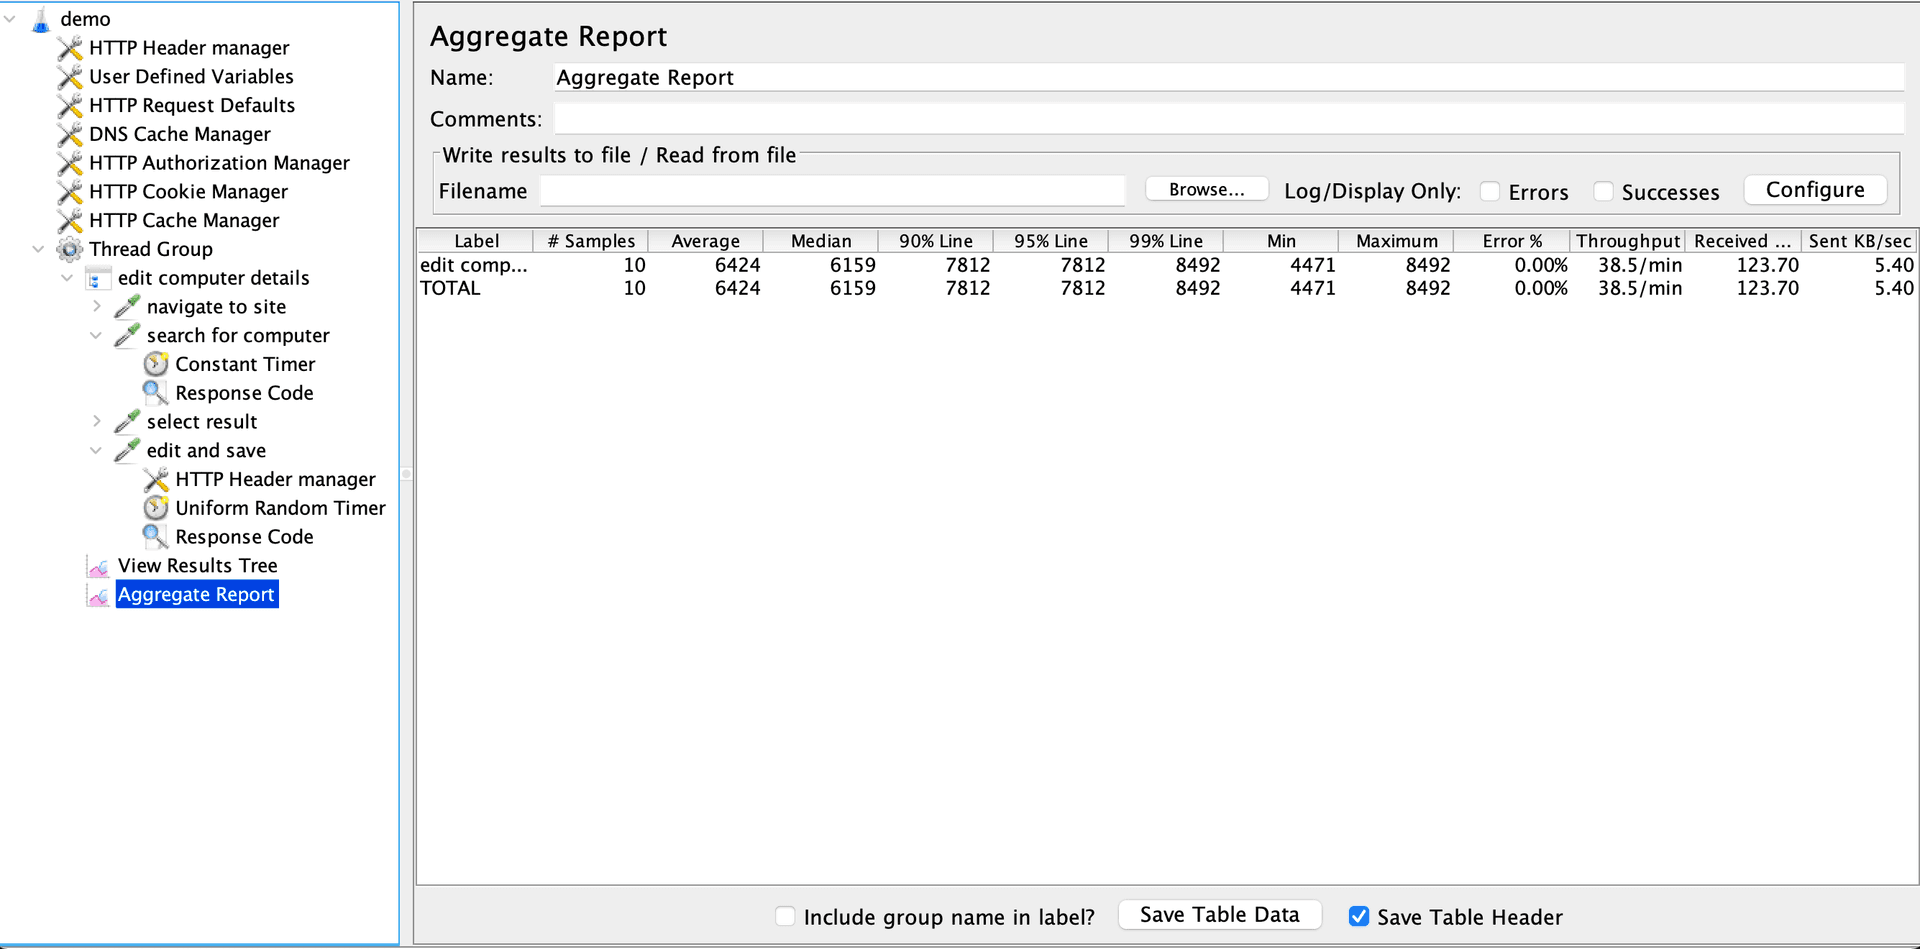
In the previous screenshot, we see the test data represented in "Aggregate Report." Notable data is "Average," meaning the average time for requests to complete, and "Throughput," representing the number of requests the server can handle per minute. In an earlier section, "Understanding Controllers," we selected the "Include duration of timer and pre-post processors in generated sample" checkbox. By checking that box, our test results include values from the delays calculated in specific requests. So, for example, we could use the data to report that the application can tolerate 38.5 requests a second at an average of six seconds to completion for the "edit a computer" scenario.
Running the Test Plan from the Command-line
We can run JMeter tests via the GUI. However, it is best to run via the command line because the GUI consumes a lot of
system memory, making tests run slowly. On a Mac or Linux machine, navigate to the "bin" folder where you have
JMeter installed and use the following command to run JMeter (run the jmeter.bat for Windows users):
sh jmeter.sh -n -t "location of your .jmx test file here" -l "location of the file to log results - ex. results.csv"
In the previous code snippet, we ran JMeter passing in parameters:
-nmeans non-GUI mode-tmeans the path to test file-lmeans the location of the file to log the results
Note that the file used to log test results will automatically be created by JMeter if it does not already exist. The following is a snippet of an example log file created as a CSV:
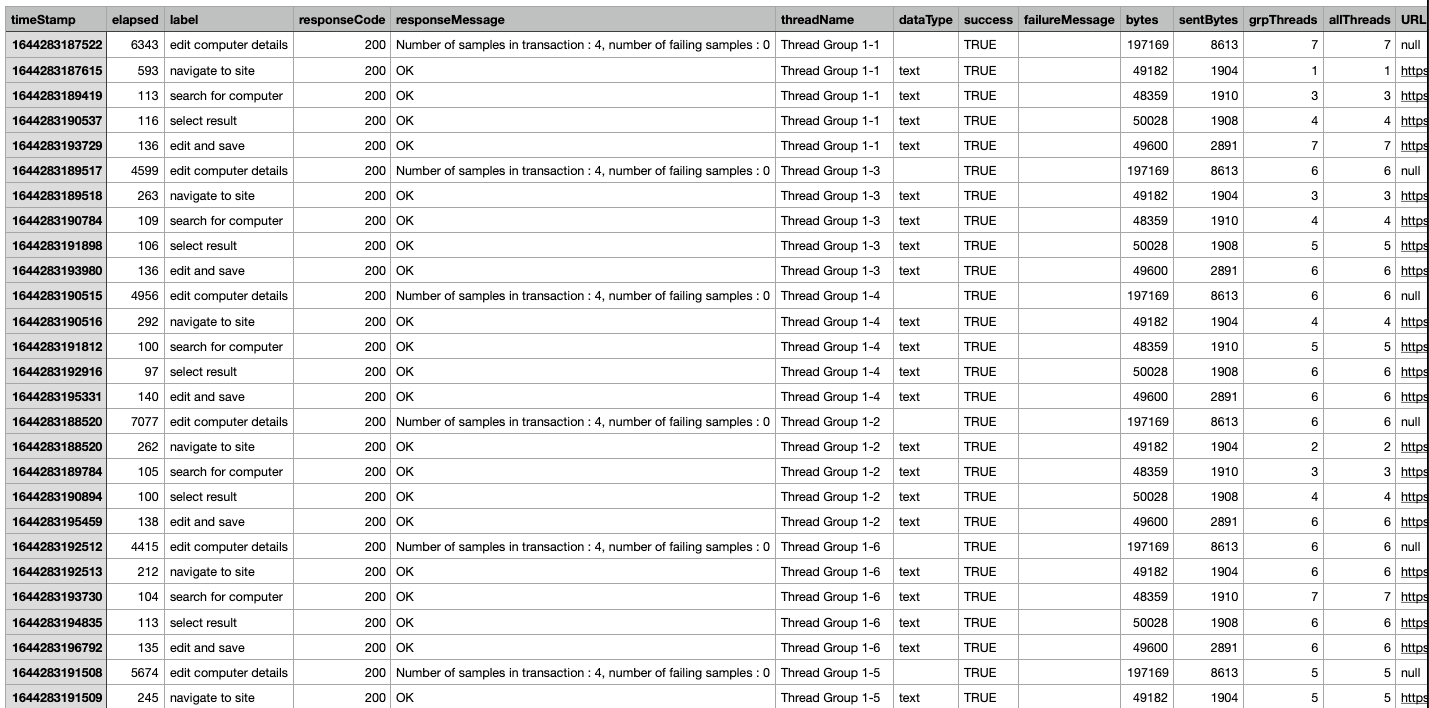
We see test run data displayed in a CSV file in the previous screenshot.
Review
In review, we learned how to create a basic performance test using JMeter and BlazeMeter. Armed with the basic Performance Testing knowledge and skills, we can now create more complex load profiles to test the performance of applications in various scenarios.